
Sep 25, 2020

Lori Gann Morris, CIMA®, AIF®, CeFT®, Co-Founder / Managing Partner
Past results are not an indication of future investment returns – this is an important principle of our philosophy. In this article we address the widening gap between growth equities and value equities and how current events are influencing our strategic outlook for the future.
So, what has happened?
The S&P 500 recently recorded its fifth straight month of net gains. We have witnessed cyclical growth stocks tied to the prospects of a reopening economy (restaurants, airlines, hotels, cruise lines, casinos, etc.) outperform as the market rebounded off of springtime lows. However, this rebound is not representative of the whole story.
Technology has been the key component of the S&P’s recent surge. Representing nearly 25% of the index, technology could be considered “the tail that wags the dog”. Prior to this phenomenon, there were no S&P 500 companies with a market cap of at least $1 trillion. Now there are four that match this criteria, with one of them valued individually at over $2 trillion. As of September 1st, the largest components of the index by market capitalization were:
- AAPL: $2.25 Trillion
- AMZN: $1.75 Trillion
- MSFT: $1.71 Trillion
- GOOG: $1.1 Trillion
For the first time, US technology is worth more than the totality of the entire European stock market.
Growth vs Value
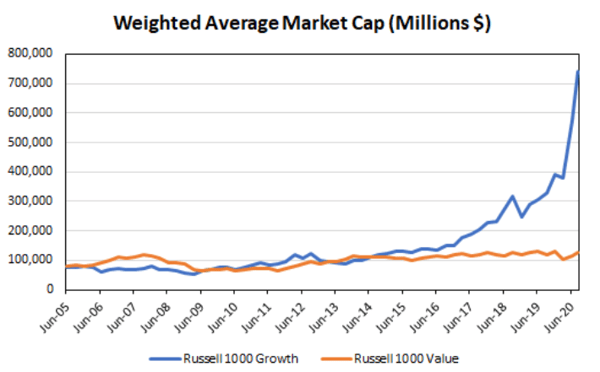
Growth has significantly outperformed Value during this cycle largely due to the performance of the technology stocks listed above. The following chart shows the change in weighted average market cap between the Russell 1000 Growth Index and the Russell 1000 Value Index:
What can be attributed to outperformance?
Recent positive returns can simply be attributed to an increase in valuation. As you are likely well aware, growing valuation multiples equate to higher share prices. It’s not difficult then, to make a case that current valuations are significantly overextended, especially growth stock valuations. The chart below illustrates the disconnect of valuation growth and growth in fundamentals (EPS, earnings per share):
.png?width=600&height=319&name=3%20(1).png)
Why does this matter?
The typical direct correlation between Growth and Value stocks no longer exists as we have grown accustomed to. Historically, this disconnect is an outlier event. The question then remains, “Will this phenomenon continue, and if so, for how long?”. We see two potential paths moving forward:
1. Technology cools off
This benefits nearly all other market segments given the size of technology. According to Tavis McCourt of Raymond James, this is a statistically unlikely outcome and indexes are not recommended holdings at this time. A reversal would mean underperformance for technology moving forward despite the incredible run the sector has had.
2. The current Growth-Value stratum remains
This scenario would lead to continued outperformance in technology and growth stocks, while simultaneously maintaining underperformance in value stocks.
Our focus continues to be holding investments as determined by our Yield & Growth Framework. This means a diversified portfolio of high-quality stocks with a delicate balance of both growth and value holdings. As a matter of principle, we hold steadfast to our philosophy and process and are currently positioned to benefit if technology continues to outperform.
At the same time, we’ve selectively begun to add exposure to stocks that could benefit from a broad transition to the value sector, and continued our practice of actively managing hedges to minimize losses. It’s a constant balancing act and we’re confident in our ability to maintain an appropriate mix within risk tolerances.
If you have any questions regarding our investment philosophy, please do not hesitate to reach out.