May 24, 2022

Lori Gann Morris, CIMA®, AIF®, CeFT®, Co-Founder / Managing Partner
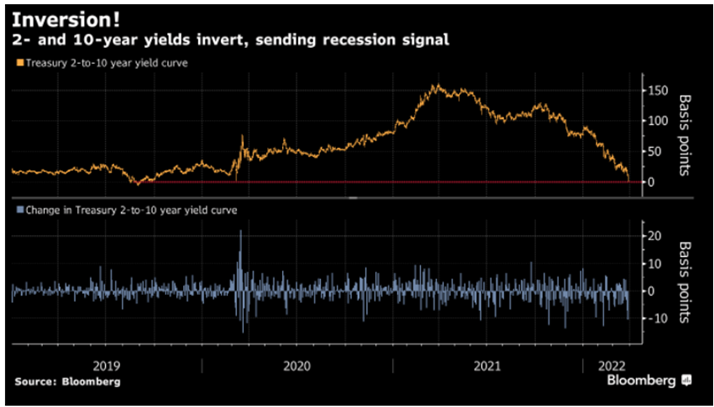
The spread between the 10-year Treasury and the 2-year Treasury has compressed materially over the first three months of 2022 (~80bps of tightening). The speed of the flattening has been concerning, catching the attention of the media with many pundits are using the “R” word.
Interest Rates 101
Long bond yields are made up of two parts: the sum of projected short-term rates plus a term premium to compensate investors for locking up their money for an extended period. The “term premium” has been reduced down to nearly zero due to central bank QE.
What does the 10yr/2yr mean?
10yr-2yr compares a proxy of the Fed’s policy rate (the shorter duration yield) to a proxy for growth and inflation expectations further down the road (the longer duration yield).
When the economy is healthy, yields on the interest rates investors are paid for buying government bonds should be higher on longer-term bonds. The fact that recessions follow inversions is quite obvious. Yield curves invert close to the peak of a cycle, and after a peak, there has always been a recession. What we don’t know is when. The recent flattening has been caused by expectations of Fed overtightening, and overtightening has indeed led to recessions in the past.
Our Take
We have to admit a curve inversion 13 days after the first hike is by far the fastest ever seen. For context, the 2019 inversion was after the 9th hike and the 2006 inversion was after the 15th (of 17) hikes. The quick take is that the curve inversion so close to the first-rate hike is a market signal that it will not take much to break things.
This time is different…or is it?
We are hearing many financial talking heads saying it’s different this time because of the pandemic, QE/Fed balance sheet, global bond investors, etc. While we acknowledge all those influences on the 10-year yield, we’ve been through this before and, in fact, all yield curve inversions have been deemed in some way or another “different this time,” but none have been different. So, what does it mean this time?!
Campbell Harvey’s 3M/10YR Indicator
In March of 2018, the San Francisco Fed published a study in which they found that an actual inversion of the curve (though they used the 10yr/1yr) was the condition precedent for a recession, not just a flattening of the curve. Looking to refine the analysis and identify which measure of the curve has been most predictive, in an Economic Letter published in August of that year the San Francisco Fed found that the 3M/10YR curve has delivered the most accurate signal since the early ‘70s. This portion of the yield curve has been steepening all year!
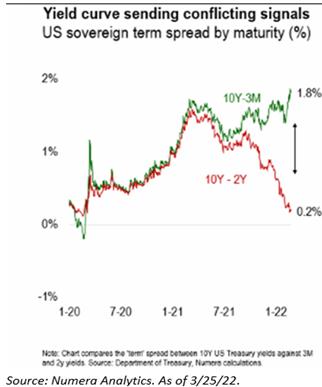
Considering that study, we can likely breathe a sigh of relief as the 3M/10YR spread today remains quite wide and has actually been steepening all year. That steepening dynamic underscores the market pricing in 1) rising inflation, 2) firming economic growth, and 3) a Fed that is behind the curve.
The chart above shows the slope of various portions of the curve over the past three years. Clearly, the different portions of the curve don’t agree with each other; this conflicting information, just by itself, is a sign that we should be careful before jumping to macroeconomic conclusions.
The Fed agrees… This time could be different
As the 2/10 spread has been collapsing, the Fed published another letter on the matter and stated, “we argue there is no need to fear the 2-10 spread, or any other spread measure for that matter…. It is not valid to interpret inverted term spreads as independent measures of impending recession.” That certainly may be the case, but for financial investors, it’s proven over the years to be a helpful signal.
The last three recessions (ex. the COVID-driven recession) began between 12- and 24-months after the 2/10 spread inverted. However, Fed officials have quarreled over the effectiveness of this indicator, with a fair amount of disagreement upon its implications particularly given the Fed’s low starting point on rates (ZIRP) and the question of whether global QE is suppressing the long end.
Today, the long end of the US yield curve is heavily distorted. The Fed has deliberately driven down the long end of the yield curve with its asset buying program. At the same time, very low bond yields outside the US exert downward pressure on US yields. Like we mentioned above, the term premium for longer duration bonds has now dropped into negative territory.
On top of Fed buying, there are several factors that many analysts believe are artificially depressing the 10-year yield (making it lower than it otherwise should be and artificially compressing the 10s-2s spread). The first of those reasons was the relative yield as bonds in Europe and other parts of the world which are considerably lower and, in many cases, negative, leading fixed income investors to look to U.S. Treasuries for safety. For example, the German Bund 10-year is still below 0.50% while the higher-risk Greek 10-year bond yielding a 2.70%. All things considered, which of those would you prefer to own? Most likely the U.S. Treasury.
Bottom line, it seems foreign demand for the 10-year Treasury has had an impact on the yield, and absent that foreign demand it does stand to reason that the 10-year yield should be higher.
Is there such thing as a Soft Landing?
Powell has pointed to three instances of soft landings as proof that the Fed can raise rates without harming the economy:
- 1964: The federal funds rates rose from 3.4% in October 1964 to 5.8% in November 1966, while the unemployment rate declined from 5.1% to 3.6%.
- 1984: The federal funds rate rose from 9.6% in February to 11.6% in August, while the unemployment rate declined from 7.8% to 7.5%.
- 1993: The federal funds rate rose from 3% in December 1993 to 6% in April 1995, while the unemployment declined from 6.5% to 5.8%
We’d note that none of these “soft landings” we’re navigated with inflation running at the rate it is today. During these periods, the Fed Funds Rate was greater than inflation.
While Chairman Powell indicated the ability to pilot a so-called soft landing, in actuality, the 3 scenarios mentioned above all have an * around them. Given the track record, we aren’t surprised the market is pricing in two rate cuts starting next year (2023) as the Fed reaches the market’s estimate of neutral (about 2.25%). Note that a couple of rate cuts do not necessarily imply we fall into a recession, but they sure imply at least a significant slowdown in the economy—the market doesn’t price in rate cuts lightly so shortly after liftoff.
Bottom Line
An inverted curve, no matter the maturities involved, is not very good at predicting the timing of recessions. Historically, recessions follow inversions with long and variable lags. What’s more, stock prices tend to appreciate between curve inversions and recessions, and sometimes a lot - it doesn’t pay to be too pessimistic as soon as the curve inverts.
The inversion this time seems to reflect the risk of a Fed policy mistake, not of an outright downturn. In particular, the powerful 10Y-3M term spread (historically the strongest recession signal) remains stable, suggesting investors are still discounting recession risks. This spread currently stands at 180bps!
While the curve inversion is scary, we would need a big(ger) inversion to persist for several quarters in order to get meaningfully bearish on the trajectory of the economy.